Introduction
In the history of the financial markets, various trading strategies have emerged over the years, each offering an approach to profiting from price movements. One such method is “Momentum Trading”. This trading strategy capitalizes on the belief that assets exhibiting persistent price trends tend to continue moving in the same direction for a period.
To assess the persistence of these price trends, traders and analysts can turn to a mathematical tool known as the “Hurst exponent”. The Hurst exponent is a valuable indicator, providing insights into the long-term behavior of an asset’s price movements.
In this blog post is an humble attempt at implementing a momentum strategy using a lesser-known metric, the Hurst exponent. Named after British hydrologist, Harold Edwin Hurst, this mathematical tool has found diverse applications in various disciplines, including finance, owing to its ability to reveal valuable insights into asset price movements.
Theoretical Foundations of the Model
The Core Principle of Momentum Trading
At the heart of Momentum Trading lies a simple yet powerful principle: “Trend Persists.” This fundamental notion suggests that assets exhibiting upward or downward price movements will continue to do so for a certain period. In essence, the idea is to ride the wave of an existing price trend and capitalize on its continuation.
Momentum traders identify assets that have demonstrated a sustained price increase over a specific historical period, indicating strong upward momentum. Similarly, they identify assets with a consistent price decline as potential candidates for shorting, representing downward momentum.
By recognizing and acting upon these persistent trends, momentum traders aim to capture profits by entering and exiting positions strategically. However, it is essential to recognize that momentum trading, like any investment strategy, comes with inherent risks, and traders must employ risk management techniques to safeguard their portfolios.
The Hurst Exponent
The Hurst exponent is a critical mathematical tool used to quantify the degree of persistence in a time series data, such as an asset’s price history. Named after Harold Edwin Hurst, who first introduced it while studying hydrology, this metric has found its way into various fields, including finance.
The Hurst exponent’s value ranges between 0 and 1, where:
- H = 0.5 suggests a random walk or a price series with no persistence.
- H > 0.5 indicates a persistent time series with a tendency to follow trends.
- H < 0.5 suggests an anti-persistent series, where price reversals are more likely.
In the context of finance, a high Hurst exponent value signifies that an asset’s price movements are likely to show strong persistence, making it an attractive candidate for momentum trading strategies. Conversely, a low Hurst exponent value indicates that the asset’s price movements might be more unpredictable or mean-reverting, less suitable for momentum trading.
The Hurst exponent for Momentum Trading
Combining momentum trading with the Hurst exponent involves a systematic approach to identify assets with persistent price trends. The process can be summarized in the following steps:
Calculating the Hurst Exponent
To begin, traders calculate the Hurst exponent for various assets of interest. This is done by analyzing their historical price data and applying mathematical techniques like the Rescaled Range Analysis (R/S Analysis) or the Detrended Fluctuation Analysis (DFA) to estimate the exponent. In this post we use a method I discribed in this article.
Selecting Assets with High Hurst Exponent
Assets with a Hurst exponent greater than 0.5 are considered to exhibit persistent price movements. These are the assets that align well with the core principle of momentum trading, as they are more likely to maintain their current trends over a certain period. In this article, we will consider the assets with an hurst exponent above of 0.6 as in persistent state.
To see more about the Hurst exponent and it’s estimation, check my previous article here.
Implementing the Momentum Strategies
Once assets with high Hurst exponents, indicating a likelihood of persistent price trends, are identified, we will focus on a more specific approach to momentum trading. For the purpose of this article, we will concentrate on the variations observed in the last 10 days of an asset’s price history. Instead of employing traditional technical indicators like Moving Averages, Relative Strength Index (RSI), or Moving Average Convergence Divergence (MACD), our focus lies on the recent positive variations in the asset’s price movements.
The rationale behind this approach is to capture the momentum of the asset’s recent upward movements. By selecting assets with consistent positive variations in the short term, we aim to ride the wave of their upward trends and potentially benefit from their continued price appreciation.
We will use the folowing approach :
- We check if the Hurst exponent is above 0.6
- If it is the case, we either take a long position if stock is bullish or short position if the stock is bearish. In both cases we will put 10 bucks.
- We then hold the stock for 3 days
A pratical implementation
Let’s now implement that in python !
Importing the data
In this project we will use the yahoo Finance API to get daily values. Using python, we can get the historical values of the Tesla stock for instance :
import yfinance as yahooFinance
TSLA_ticker = yahooFinance.Ticker("TSLA")
TSLA_ticker_history = TSLA_ticker.history(period="max")
In this post, we will work we a small selection of historical American stocks :
- JNJ: Johnson & Johnson
- XOM: Exxon Mobil Corporation
- IBM: International Business Machines Corporation
- C: Citigroup Inc.
- GE: General Electric Company
- F: Ford Motor Company
- T: AT&T Inc.
- MMM: 3M Company (formerly Minnesota Mining and Manufacturing Company)
- WMT: Walmart Inc.
- JPM: JPMorgan Chase & Co.
- MCD: McDonald’s Corporation
- DIS: The Walt Disney Company
- PG: Procter & Gamble Company
- KO: The Coca-Cola Company
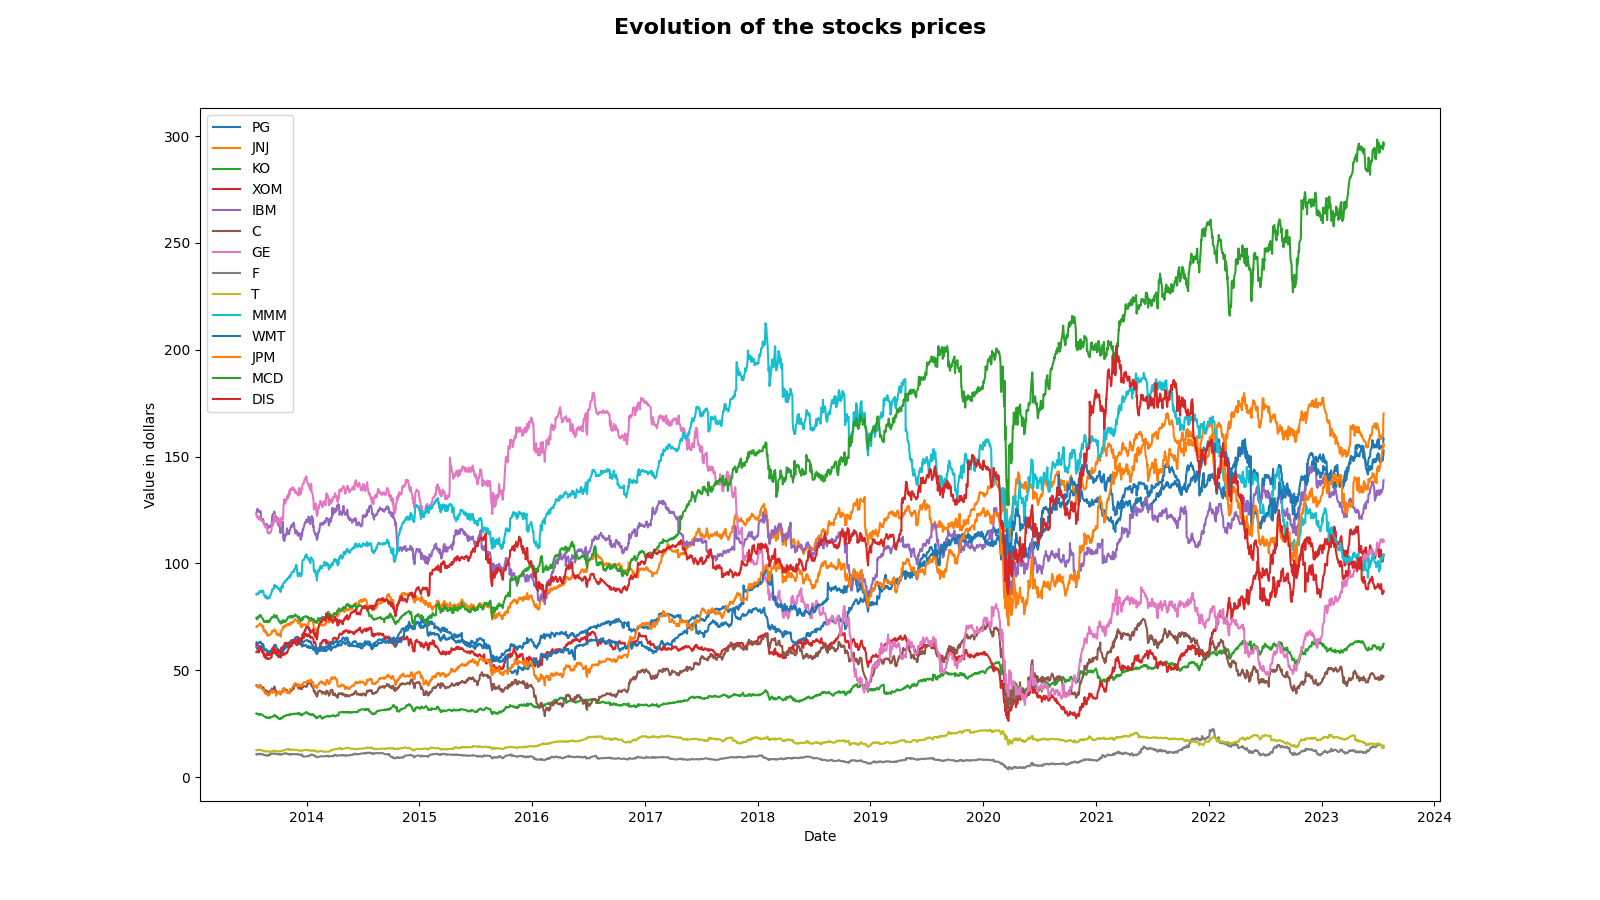
These stocks had over the last 10 years the folowing evolution :

Coding the strategy
First of all, since we work on python we have to make to necessary imports :
from tqdm import tqdm
import pandas as pd
import numpy as np
import matplotlib.pyplot as plt
import seaborn as sns
import yfinance as yahooFinance
from yfinance.tickers import Tickers
from typing import List, Tuple
We then define some constants that will come in handy for the folowing :
N_DAYS = 2518
HOLDING_PERIOD = 2
PERSISTENT_THRESHOLD = 0.60
HURST_PERIOD = 20
MISE = 10
tickers = [
  "JNJ", "XOM", "IBM",
  "C", "GE", "F", "T",
  "MMM", "WMT", "JPM",
  "MCD", "DIS", "PG", "KO",
  ]
Since we need the Hurst exponent, we have to construct an estimator. We will use the folowing :
def hurst_estimator(log_prices:np.ndarray)->float:
  """
  Computes the Hurst exponent of a log_prices
  Input:
    - log_prices (np.ndarray): historical log prices
  Output:
    - hurst (float): the hurst exponent
  """
  numerator = np.sum((log_prices[1:]-log_prices[:-1])**2)
  log_prices_bis = np.array([log_prices[2 * i] for i in range(0, len(log_prices)//2)])
  denominator = np.sum((log_prices_bis[1:]-log_prices_bis[:-1])**2)
  hurst = -1/2 * np.log2(numerator / (2 * denominator))
  return hurst
Finally, lets implement our momentum trading strategy. To do so we will use a functionnal approach :
def strategy_positions(log_prices:np.ndarray, hurst_exponents:List[float])->np.ndarray:
  """
  Compute the position of the momentum strategy for serie
  Inputs:
    - log_prices (np.ndarray): the stock log prices
    - hurst_exponents (List[float]): the hurst exponent at each day
  Output:
    - positions (np.ndarray): the strategy positions
  """
  n = len(log_prices)
  positions = np.zeros(n)
  for day, hurst in zip(range(HOLDING_PERIOD, n-HOLDING_PERIOD), hurst_exponents):
    if hurst > PERSISTENT_THRESHOLD:
      if log_prices[day-HOLDING_PERIOD]<log_prices[day]:
        positions[day] = 1
      else:
        positions[day] = -1
  return(positions)

def strategy_exposure(positions:np.ndarray)->np.ndarray:
  """
  Computes the exposition of the strategy
  Input:
    - positions (np.ndarray): the strategy positions
  Output:
    - exposure (np.ndarray): the strategy exposure
  """
  exposure = np.zeros(positions.shape)
  exposure = np.abs(positions) * MISE
  exposure[HOLDING_PERIOD:] -= np.abs(positions[:-HOLDING_PERIOD]) * MISE
  return exposure

def strategy_capital_gains(
    close_prices:np.ndarray,
    open_prices:np.ndarray,
    positions:np.ndarray
    )->np.ndarray:
  """
  Computes the capital gain of the strategy for one stock
  Inputs:
    - open_prices (np.ndarray): the serie of the open prices
    - close_prices (np.ndarray): the serie of the close prices
    - positions (np.ndarray): the positions taken
  Output:
    - capital_gain (np.ndarray): the capital gain
  """
  capital_gains = np.zeros(len(close_prices))
  for i, position in enumerate(positions):
    if position == 1:
      capital_gains[i] = MISE * (open_prices[i+HOLDING_PERIOD] - close_prices[i])/close_prices[i]
    elif position == -1:
      capital_gains[i] = MISE * (close_prices[i] - open_prices[i+HOLDING_PERIOD])/close_prices[i]
    else:
      pass
  return capital_gains

def strategy_yields(
    close_prices:np.ndarray,
    open_prices:np.ndarray,
    positions:np.ndarray
    ):
  """
  Compute the strategy yields
  Inputs:
    - close_prices (np.ndarray): the serie of the close prices
    - open_prices (np.ndarray): the serie of the open prices
    - positions (np.ndarray): the positions taken
  Output:
    - yields (np.ndarray): the serie of the yields
  """
  yields = []
  for i, position in enumerate(positions):
    if position == 1:
      yields.append(
          100*(open_prices[i+HOLDING_PERIOD] - close_prices[i])/close_prices[i]
          )
    elif position == -1:
      yields.append(
          100*(close_prices[i] - open_prices[i+HOLDING_PERIOD])/close_prices[i]
          )
    else:
      pass
  return yields

def strategy(open_prices:pd.Series, close_prices:pd.Series)->Tuple[np.ndarray]:
  """
  Computes the global strategy
  Inputs:
    - open_prices (pd.Series): the open prices serie
    - close_prices (pd.Series): the close prices serie
  Outputs:
    - exposure (np.ndarray): the exposition
    - capital_gains (np.ndarray): the capital gains
    - yields (np.ndarray): the yields
  """
  log_prices = np.log(close_prices.shift(1).dropna())
  hurst_exponents = [
      hurst_estimator(
          log_prices.iloc[i-HURST_PERIOD:i].values
          ) for i in range(
              HURST_PERIOD, len(close_prices)-HURST_PERIOD
              )
          ]
  hurst_exponents = pd.Series(hurst_exponents)
  hurst_exponents = hurst_exponents.rolling(4).mean()
  positions = strategy_positions(log_prices, hurst_exponents)
  exposure = strategy_exposure(positions)
  capital_gains = strategy_capital_gains(close_prices, open_prices, positions)
  yields = strategy_yields(close_prices, open_prices, positions)
  return (exposure, capital_gains, yields)
Finally we run the momentum trading strategy for each of the portfolio’s stock :
portfolio = {stock:{} for stock in tickers}

for stock in tqdm(portfolio):

  df = yahooFinance.Ticker(stock).history(period="10y")

  open_prices = df["Open"]
  close_prices = df["Close"]

  stock_strategy = strategy(open_prices, close_prices)

  portfolio[stock]["exposure"] = stock_strategy[0]
  portfolio[stock]["capital_gains"] = stock_strategy[1]
  portfolio[stock]["yields"] = stock_strategy[2]
  first_price = close_prices.iloc[0]
  portfolio[stock]["benchmark"] = close_prices.apply(
      lambda x : MISE * ((x/first_price)-1)
      )
Results
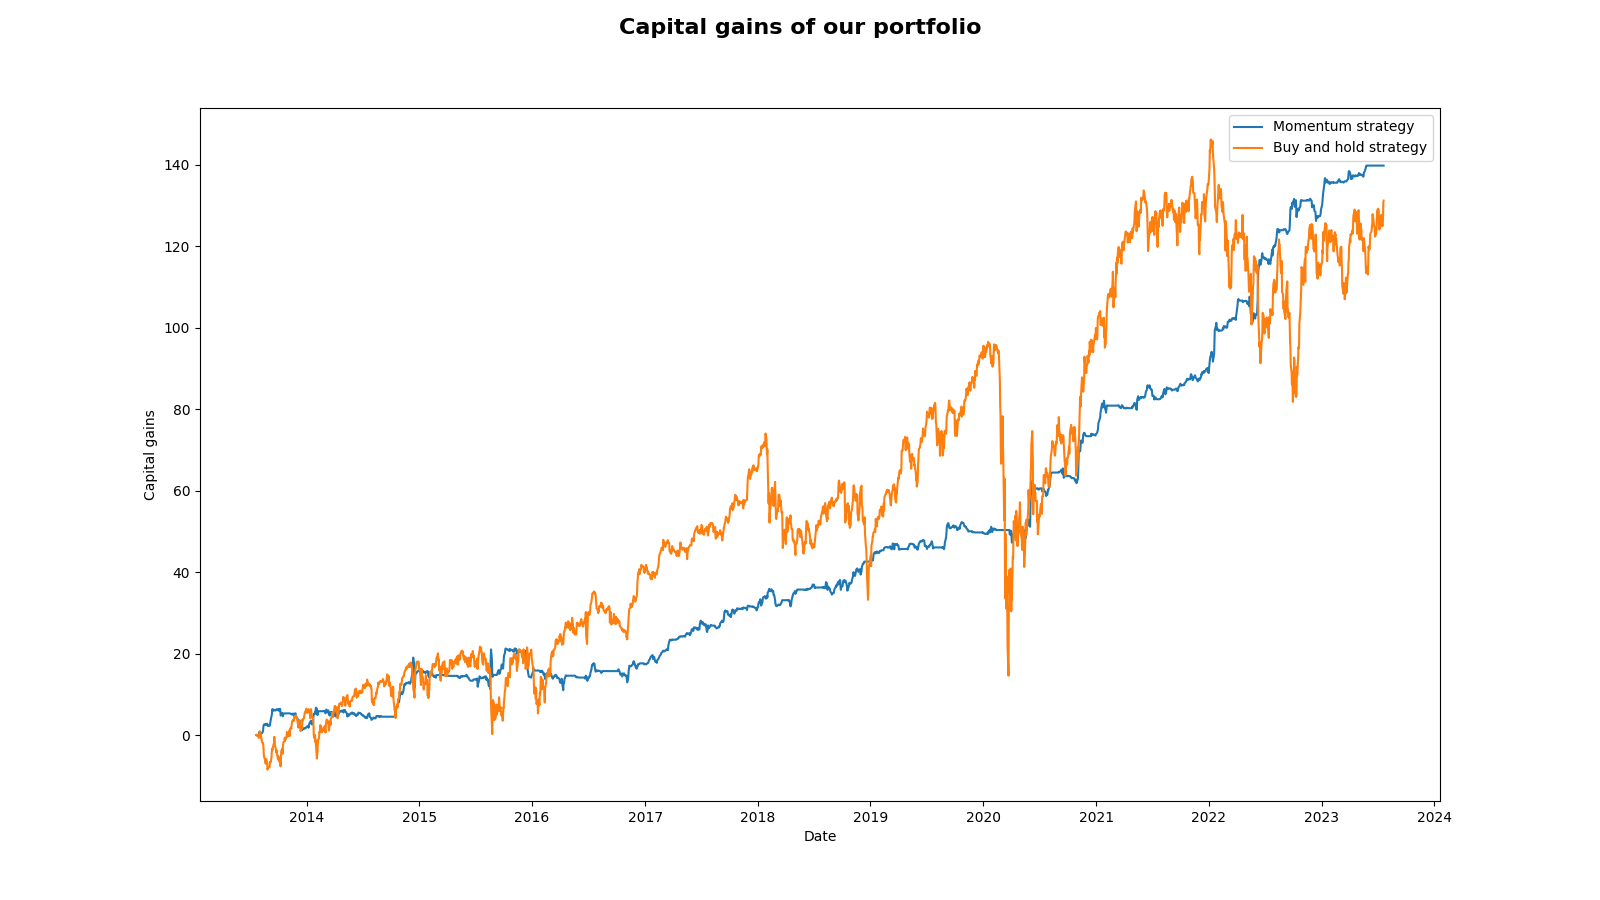
Now that we an coded our momentum strategy, we can take a look at our results. To make a comparaison and take into account the trend of the market, we also implement a buy and hold strategy and check its results.
First we can look at the strategy performance for each stock :

First of all, both strategies have gained capital for some stock and loss capital for some stocks. But from this graph, it doesn’t seems our momentum trading strategy added value in comparaison to the buy and hold strategy. In order to check that, we look at the portfolio performance :

Indeed, it appears we have almost no extra capital gain with our strategy. Yet, if look at both strategies performance, our trading strategy seems to get smoother returns.
Conclusion
I haven’t find a way to become a billionaire yet !
